Back from the Rack
Surely this scales.
2025 - Present
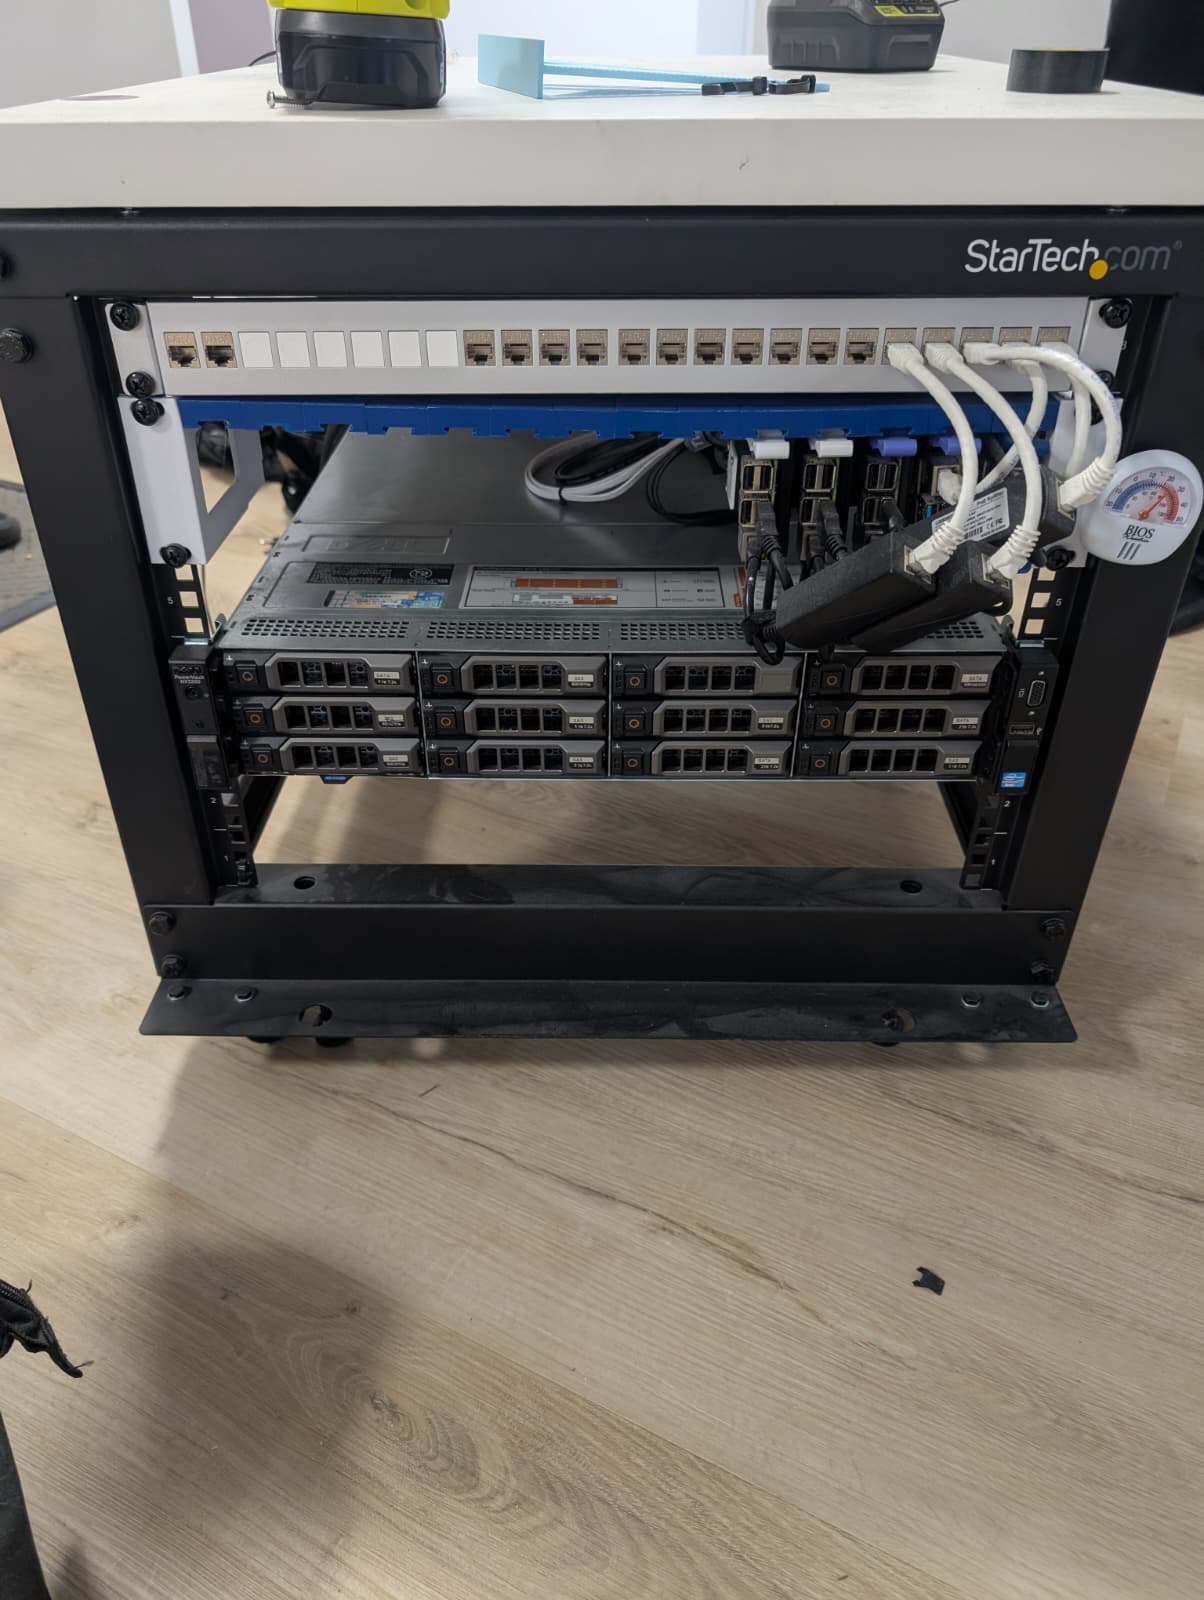
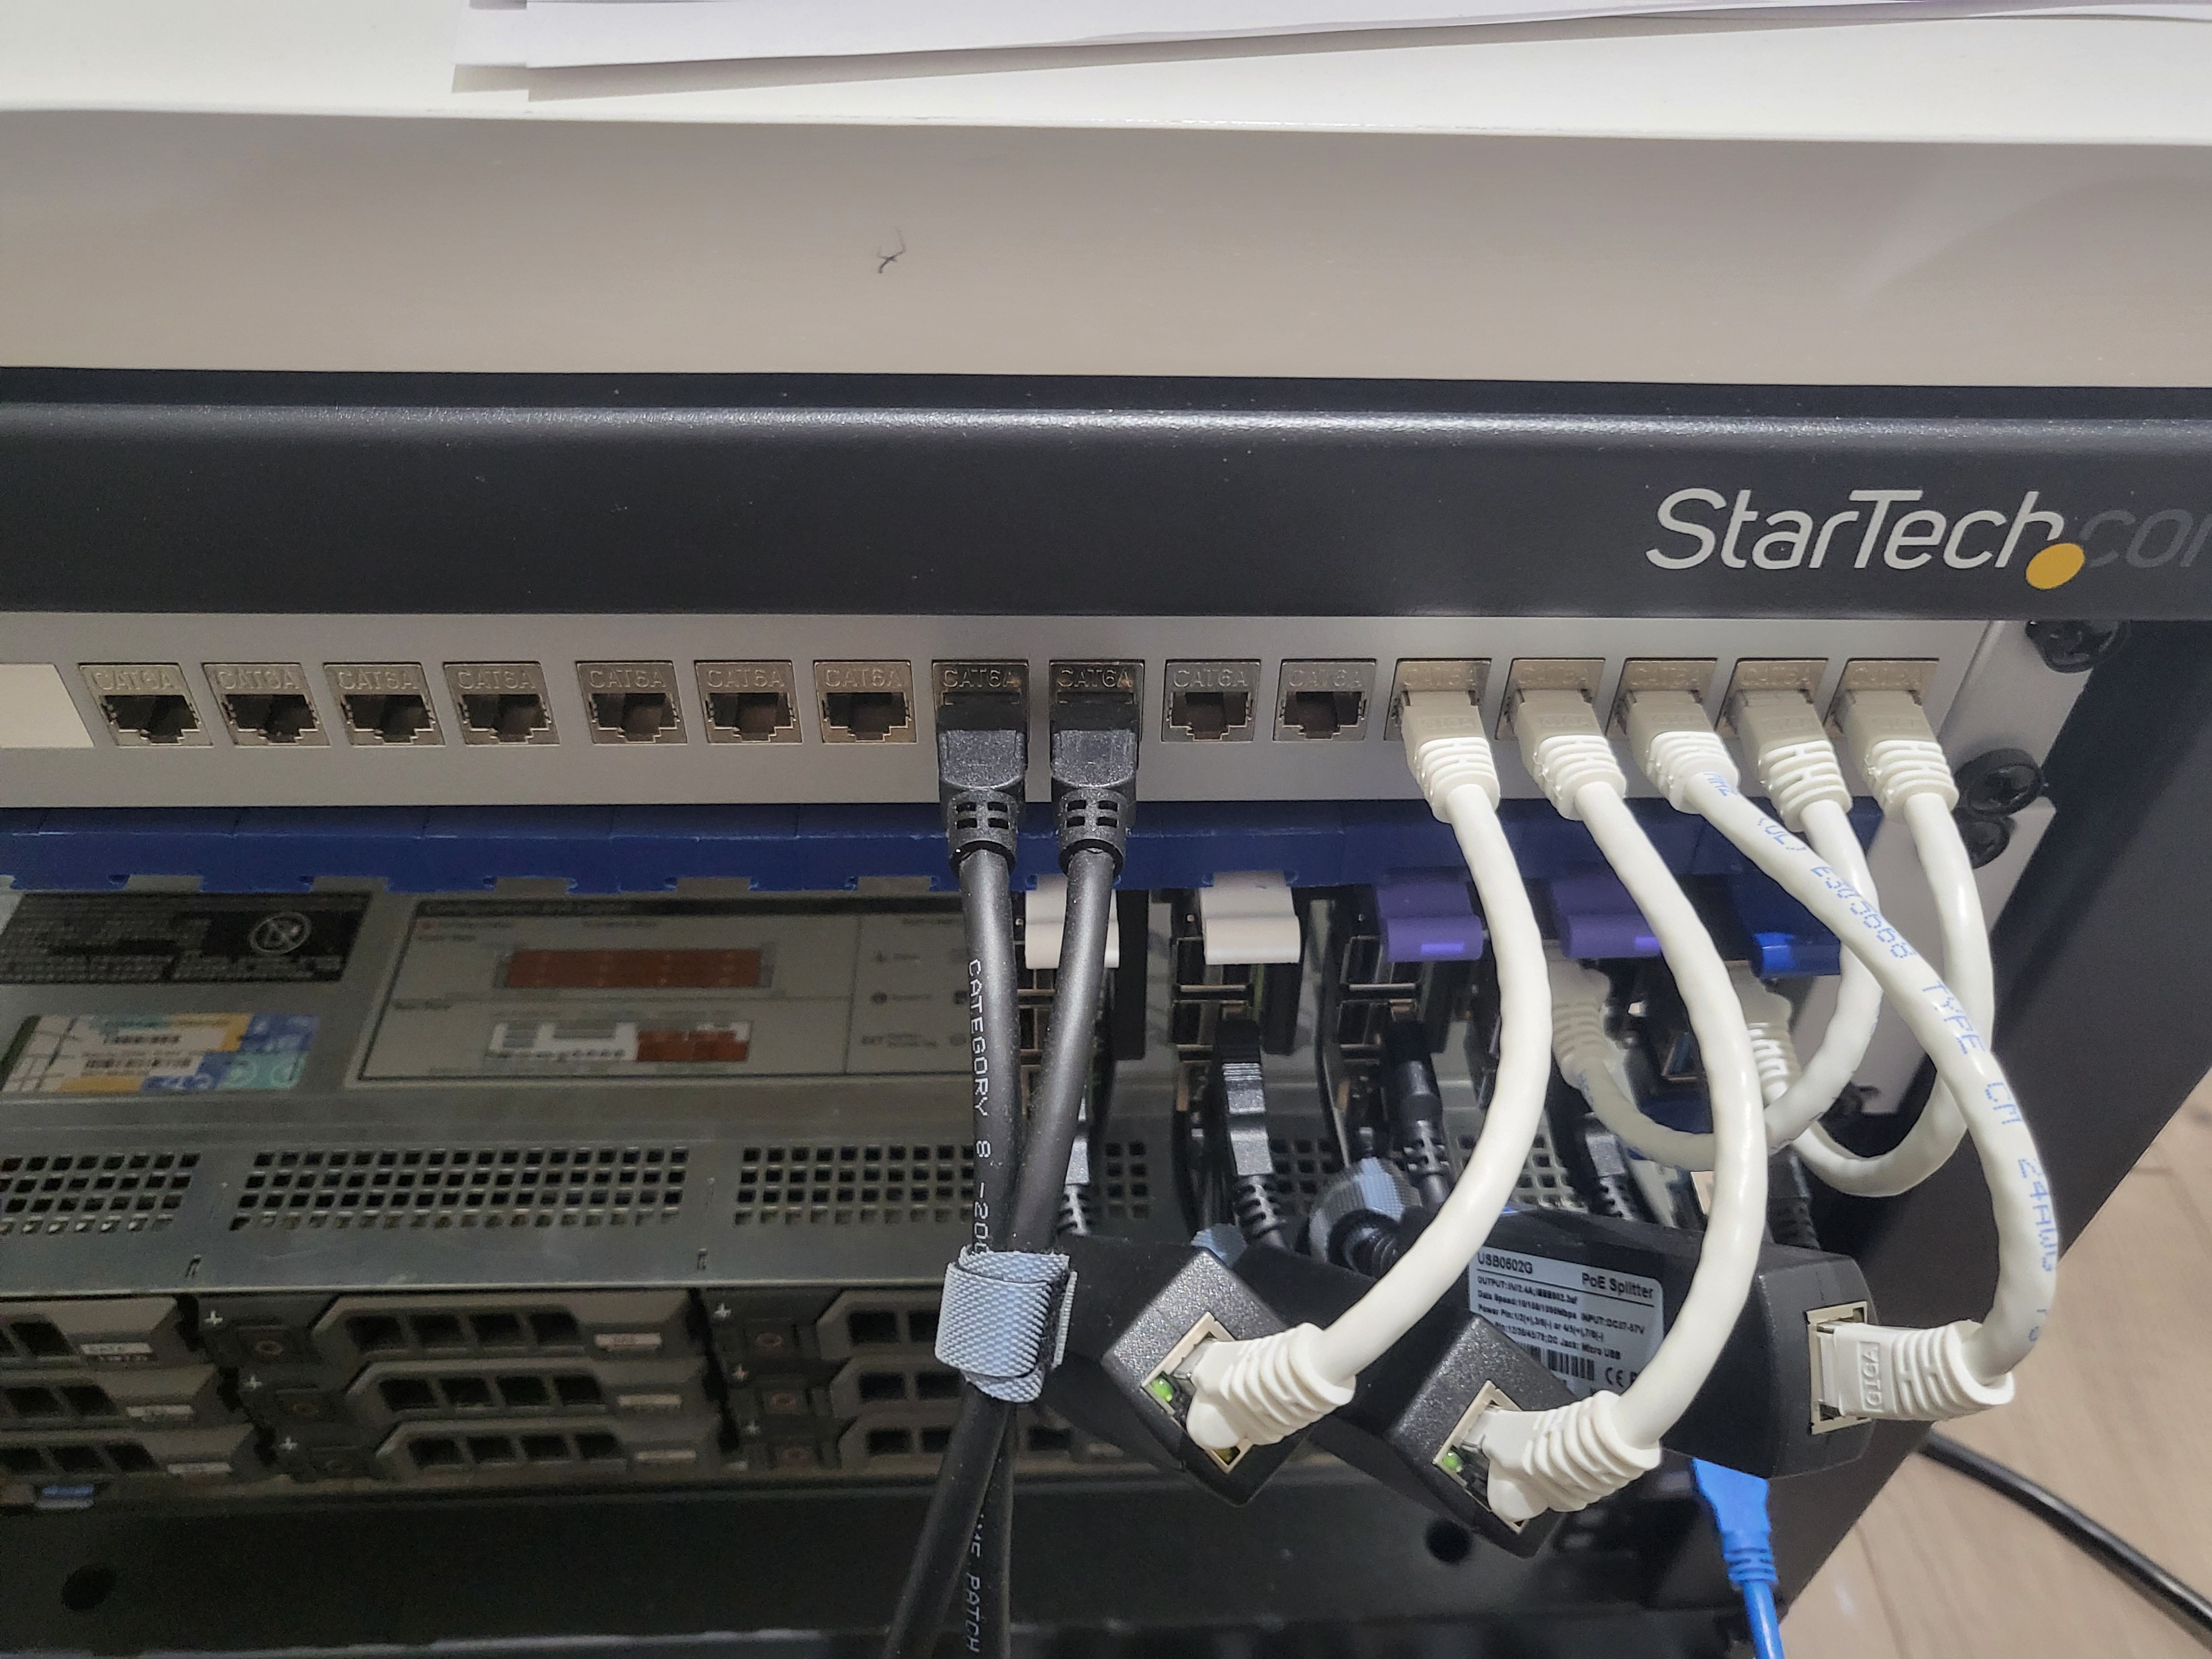
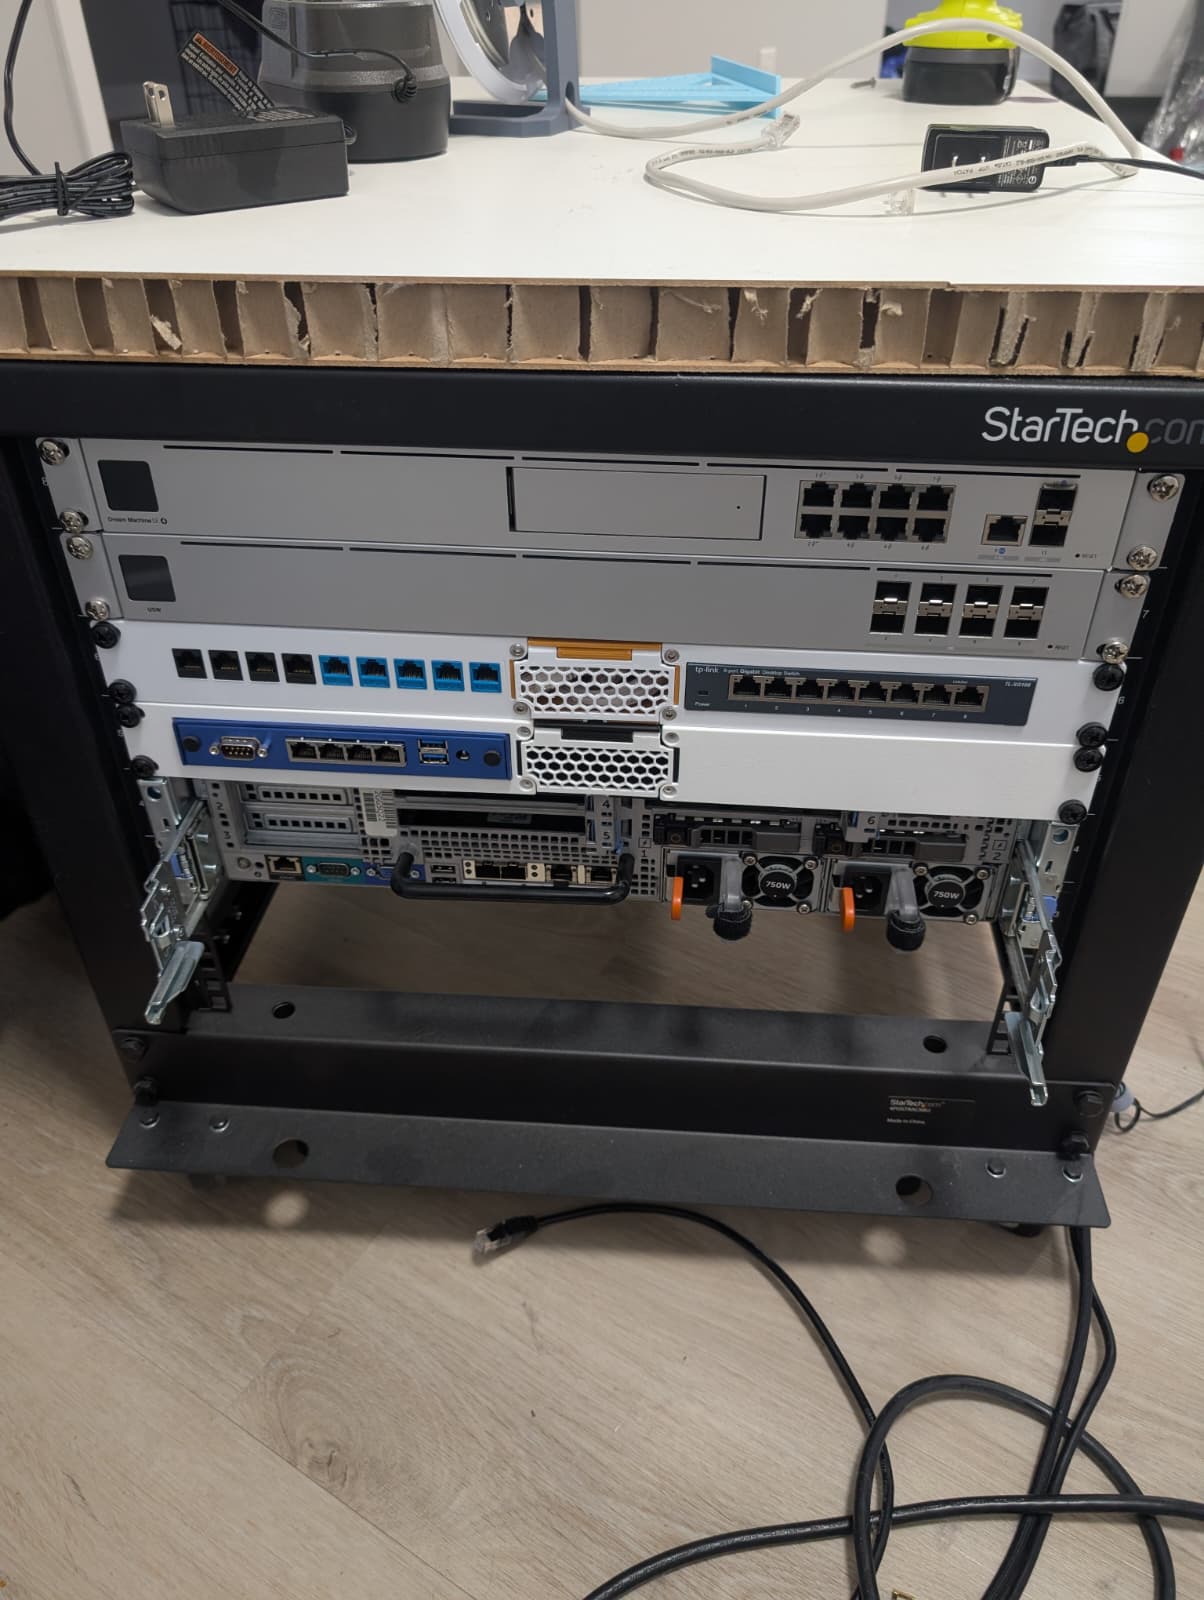
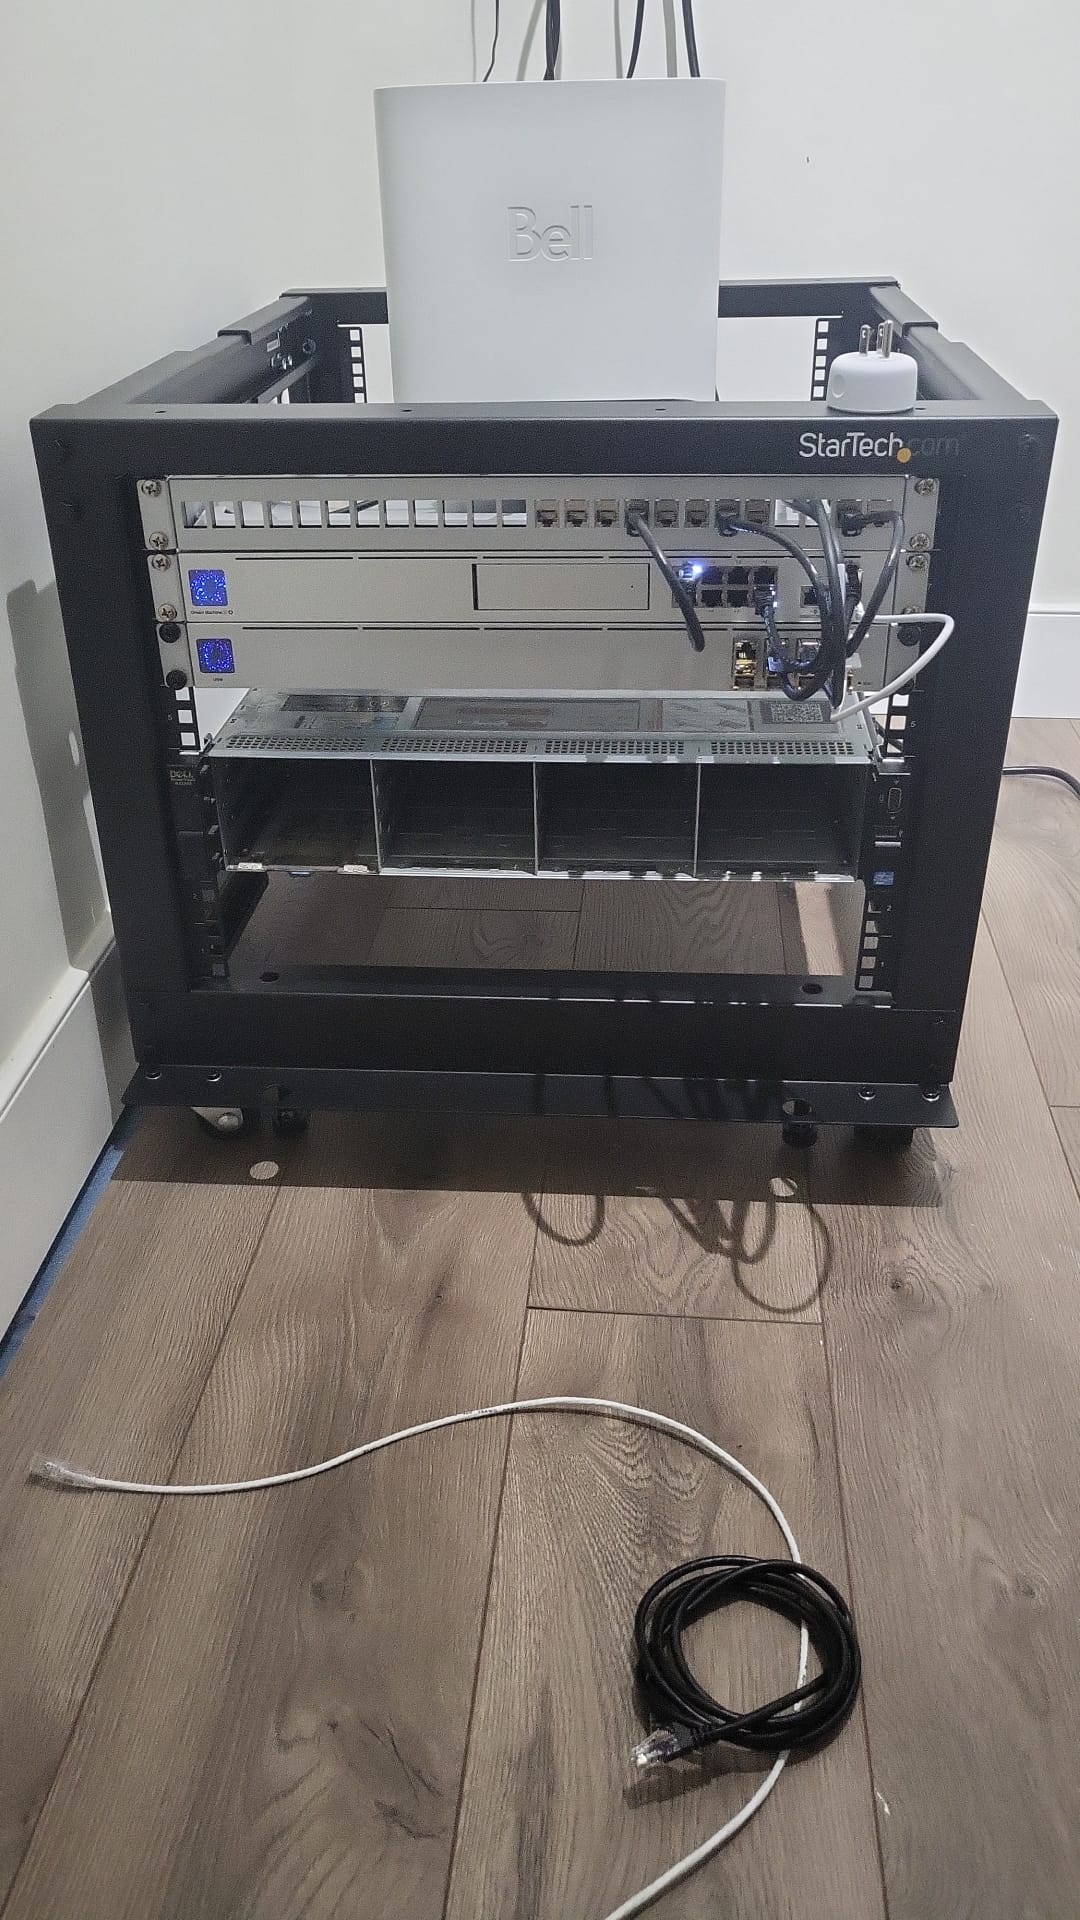
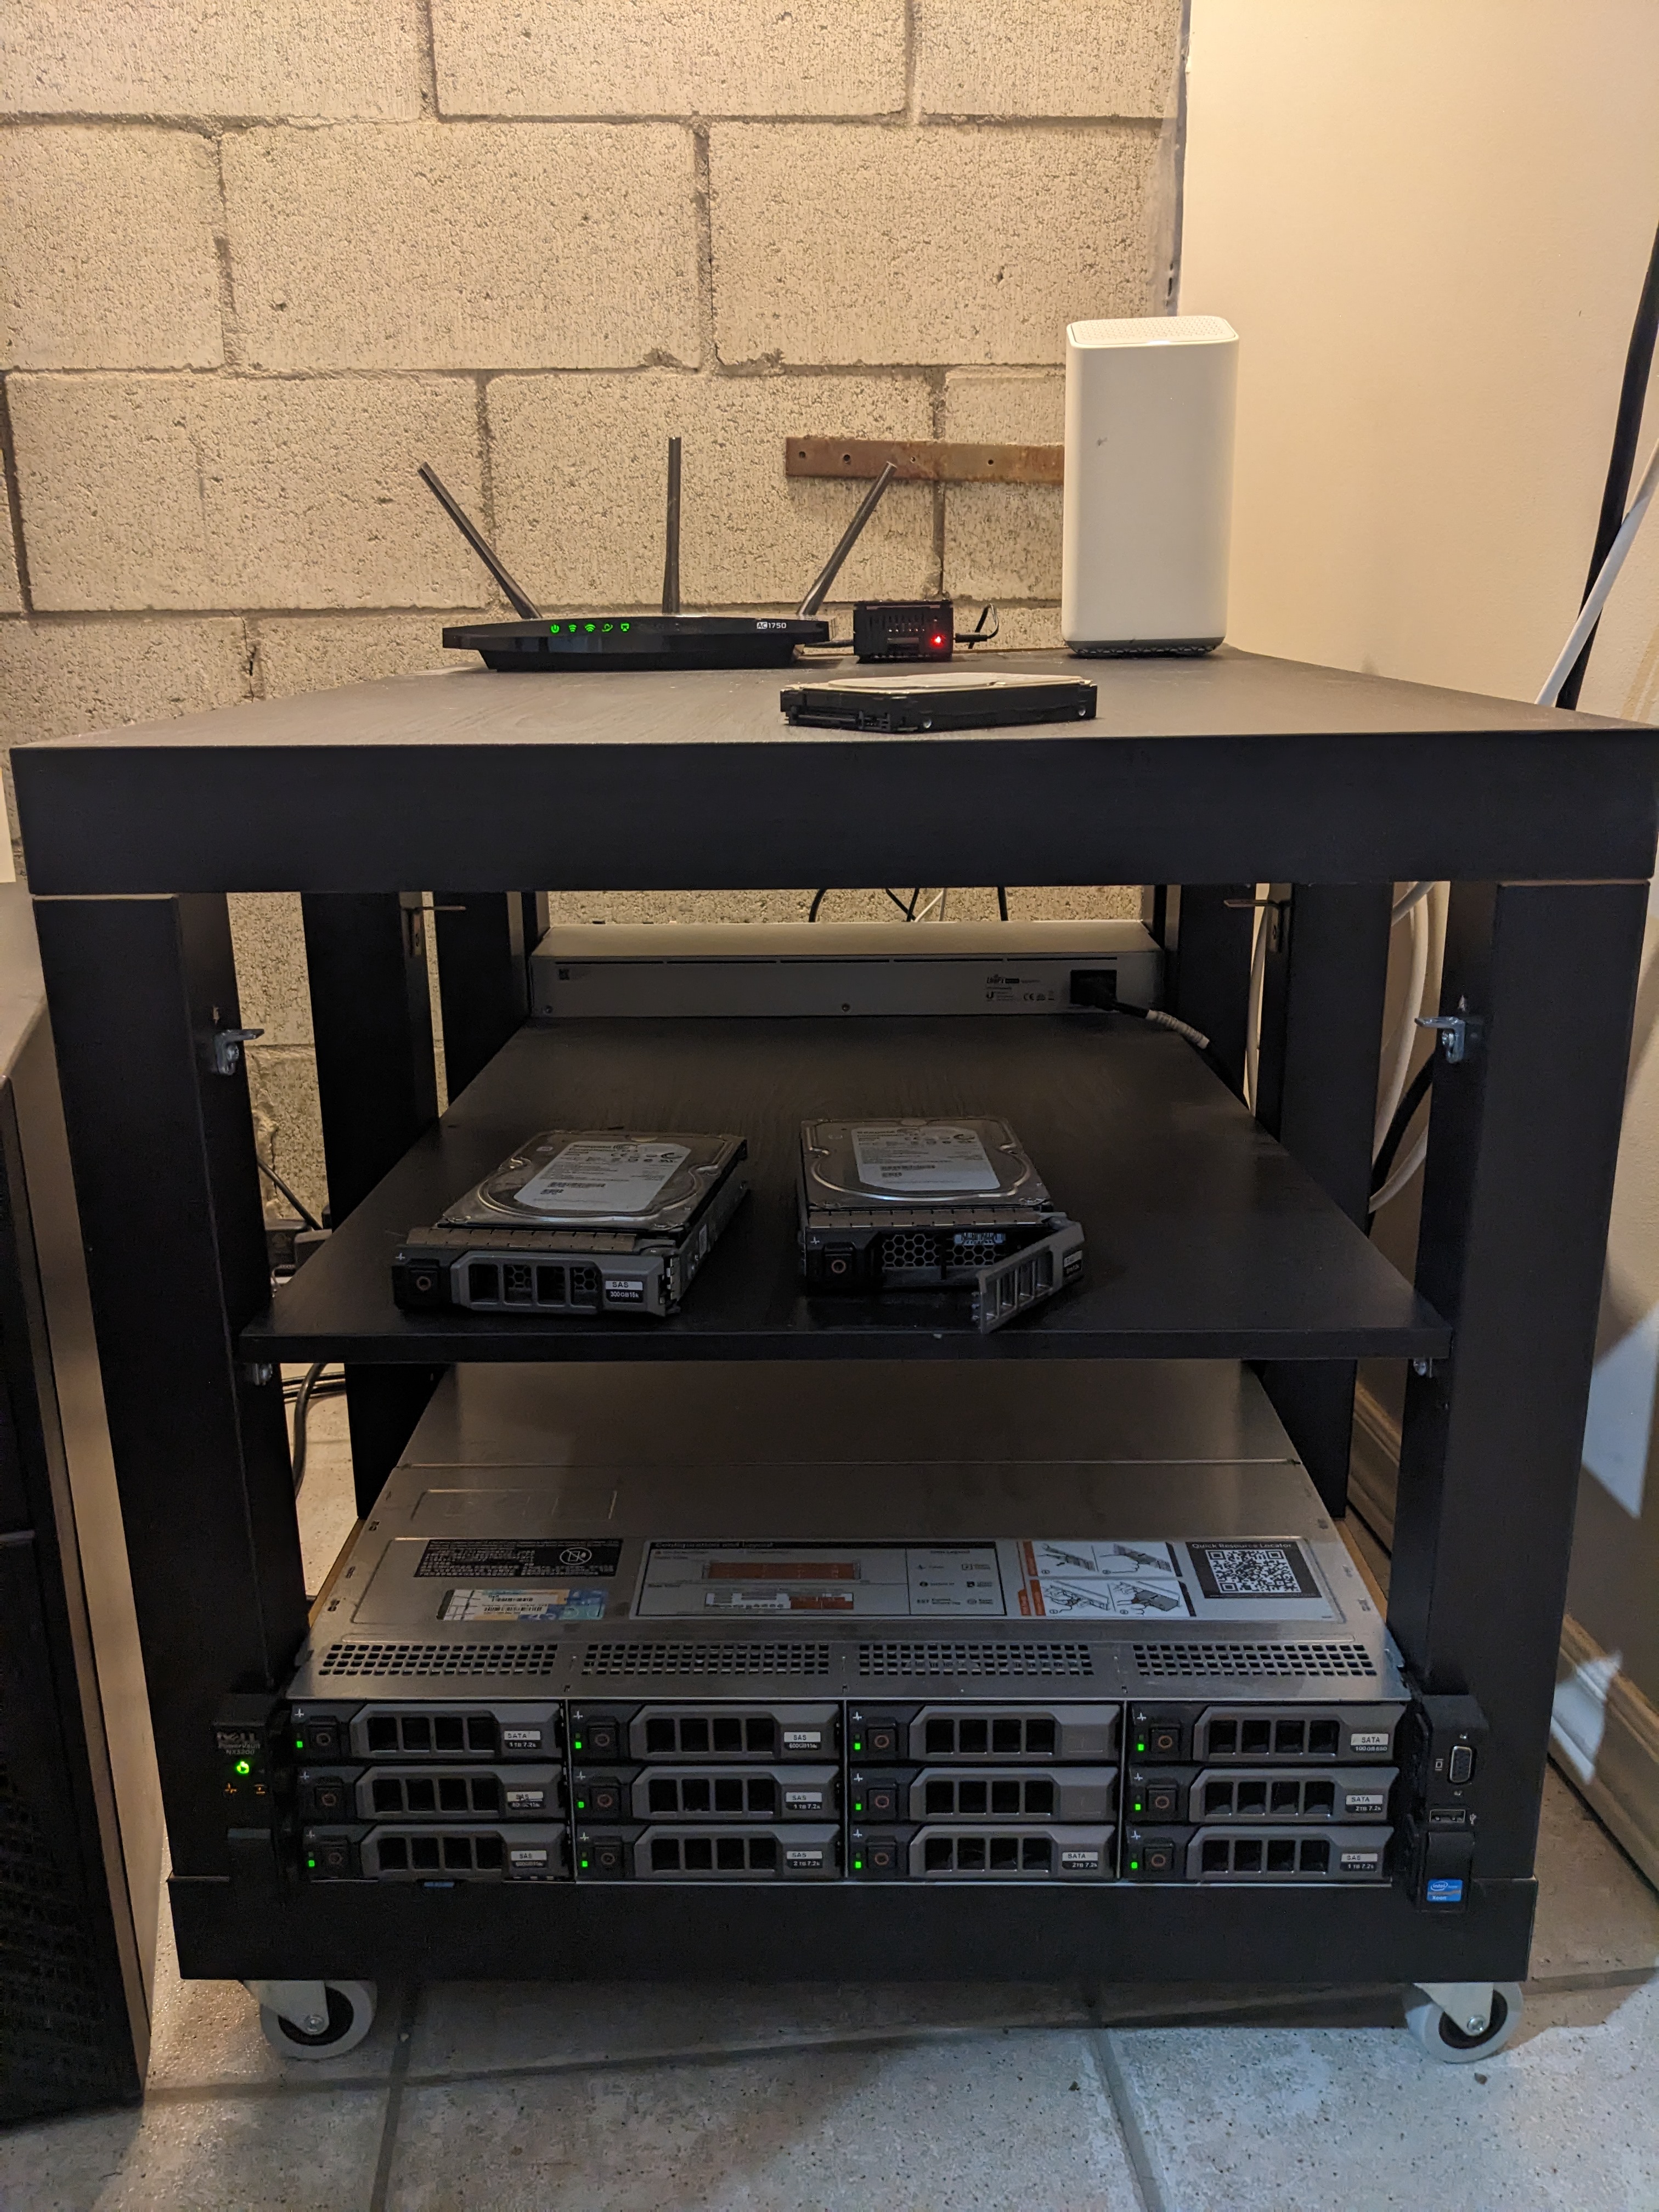
V5 is the current lab and is still being finished. The previous rack survived four moves, but an R720xd and a pile of supporting hardware no longer made much sense in a condo. The live architecture page is already up to date; this write-up will be expanded once the remaining migrations and hardware work are finished.
Downsizing in progress.
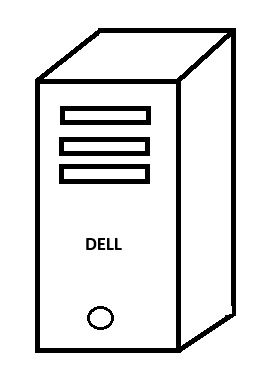
V2 through V4 were built around the Dell R720xd. For V5 I moved the primary workloads onto Unity, a tower assembled mostly from hardware I already had: a Ryzen 5 5500, 32 GB of RAM, GTX 1080, Intel i350 NIC, 1 TB NVMe system drive, and a 28 TB data drive.
Unity runs Debian 12 and Docker directly. Most of the general-purpose services that previously lived across Proxmox and the Raspberry Pi fleet now run as containers on this host, which gets rid of a large amount of hardware without adding another virtualization layer.
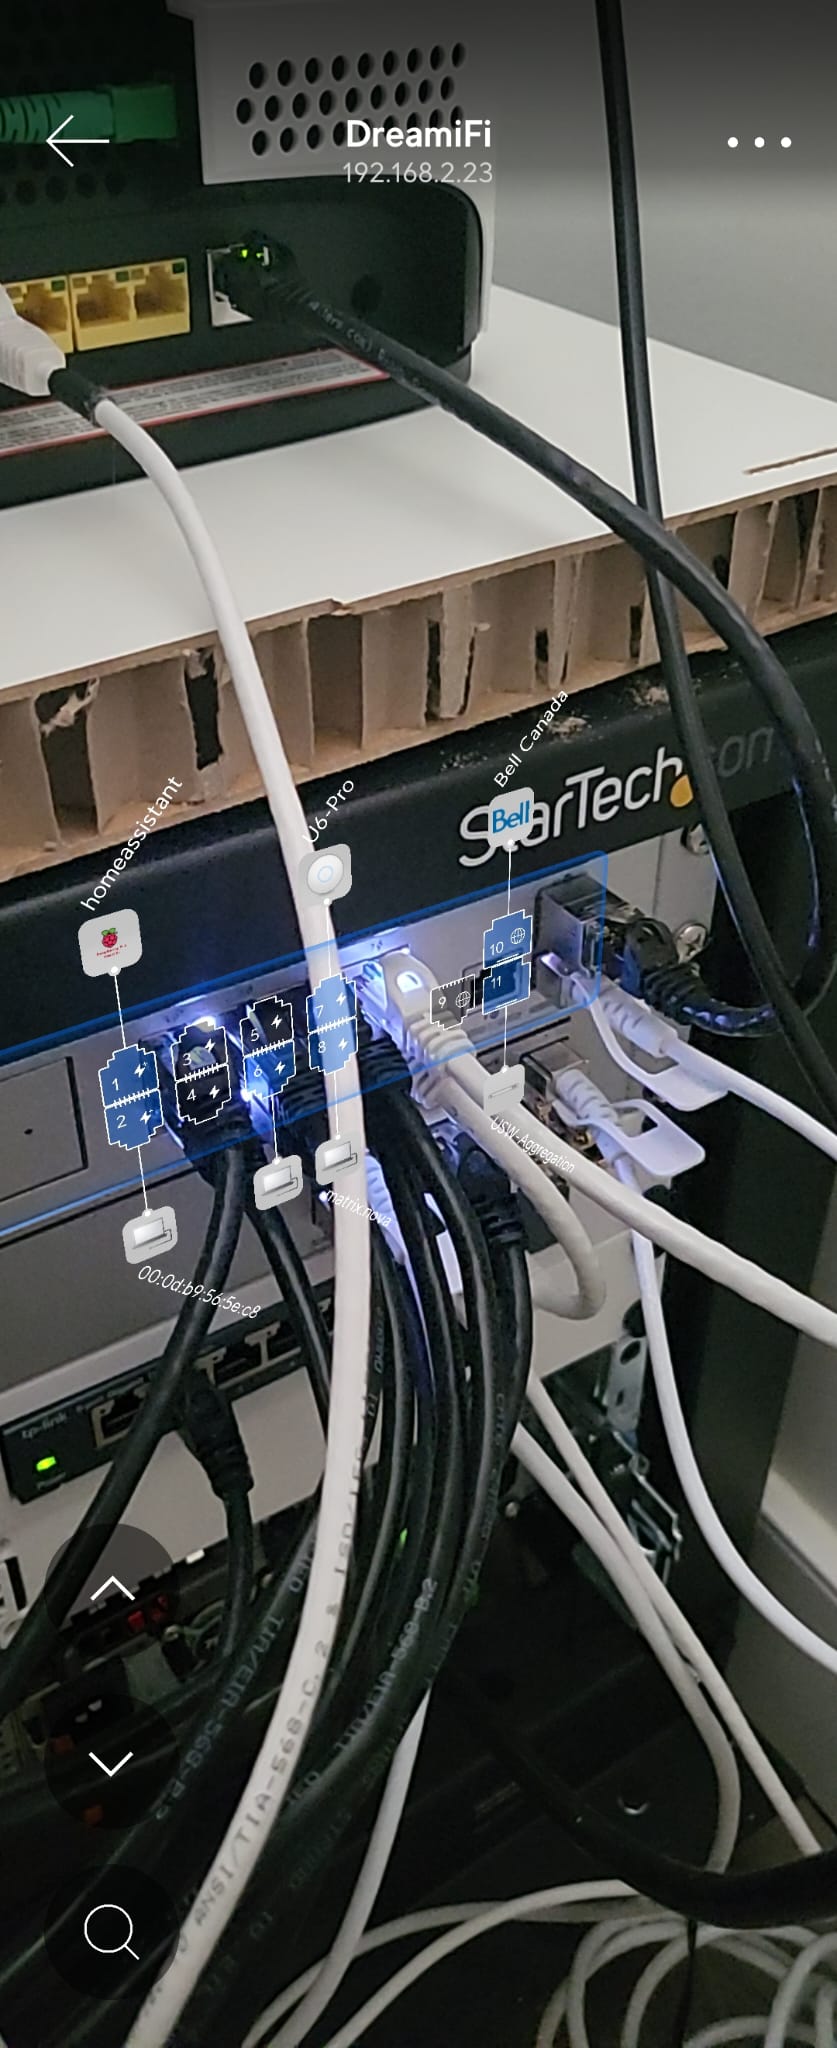
I kept the roles that benefit from physical separation off Unity. Pi-hole remains on a separate Raspberry Pi, the APU4D2 now runs pfSense as the boundary for the DMZ, and Tartarus — a Raspberry Pi 4 with a 250 GB SSD — hosts the public-facing Docker environment behind Traefik.
Finally adding source control
V5 moves the Docker stack definitions and supporting configuration into a dedicated HomeLab Git repository. The repository is checked out on Unity, with service configuration bind-mounted into the containers that need it.
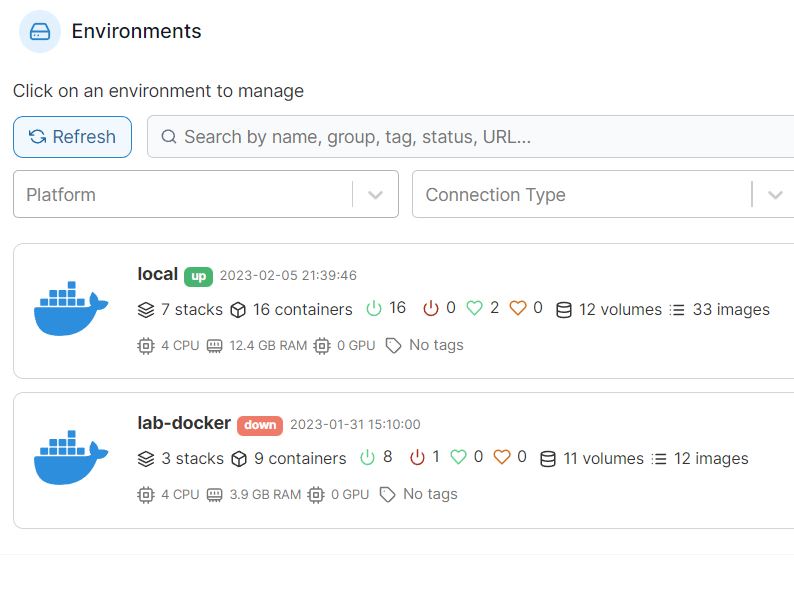
Portainer is still the management interface, but it is no longer where the configuration primarily lives. Changes are made in Git, pulled onto the host, and deployed by recreating the affected stack. That gives me version history for the Compose files and service configuration instead of relying on whatever happens to exist in the Portainer editor.
Compose definitions and service configuration are versioned together in the HomeLab repository.
Stack deployment and day-to-day container management remain available through Portainer.
Unity and Tartarus remain separate Docker hosts for trusted and public-facing workloads.
The monitoring stack is back!
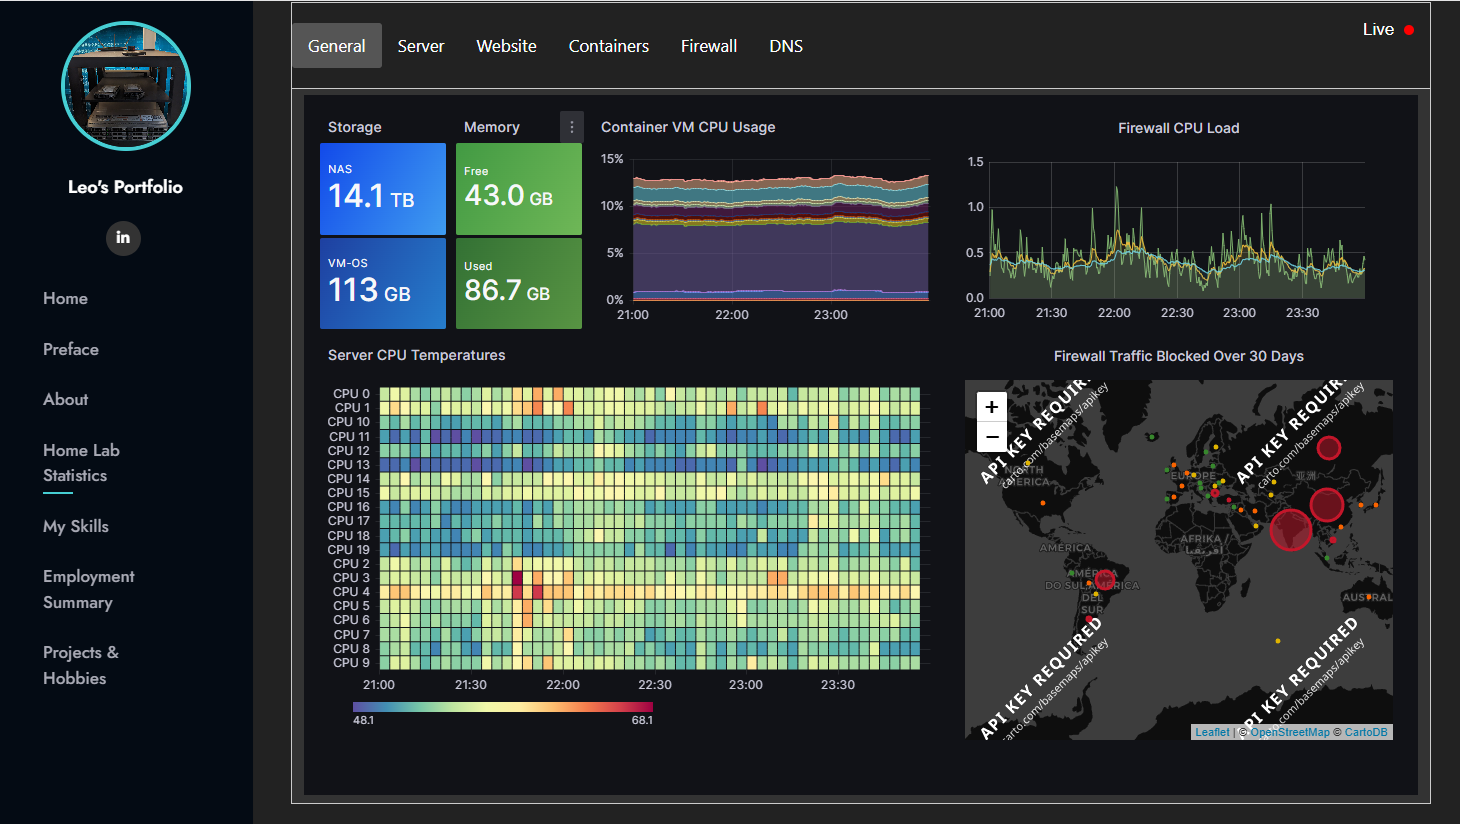
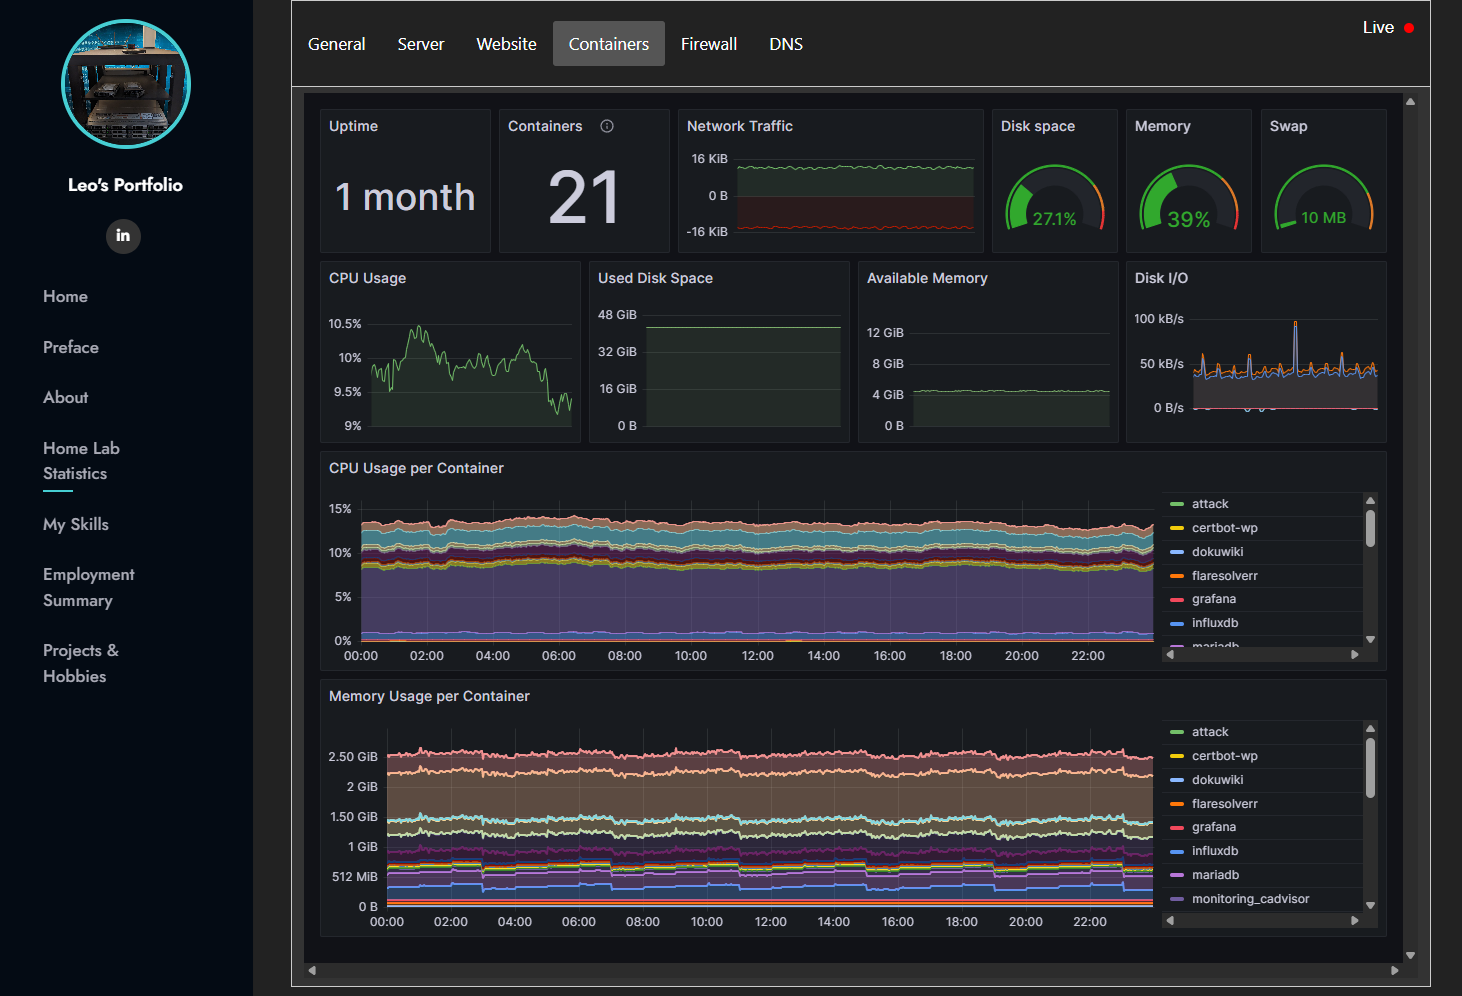
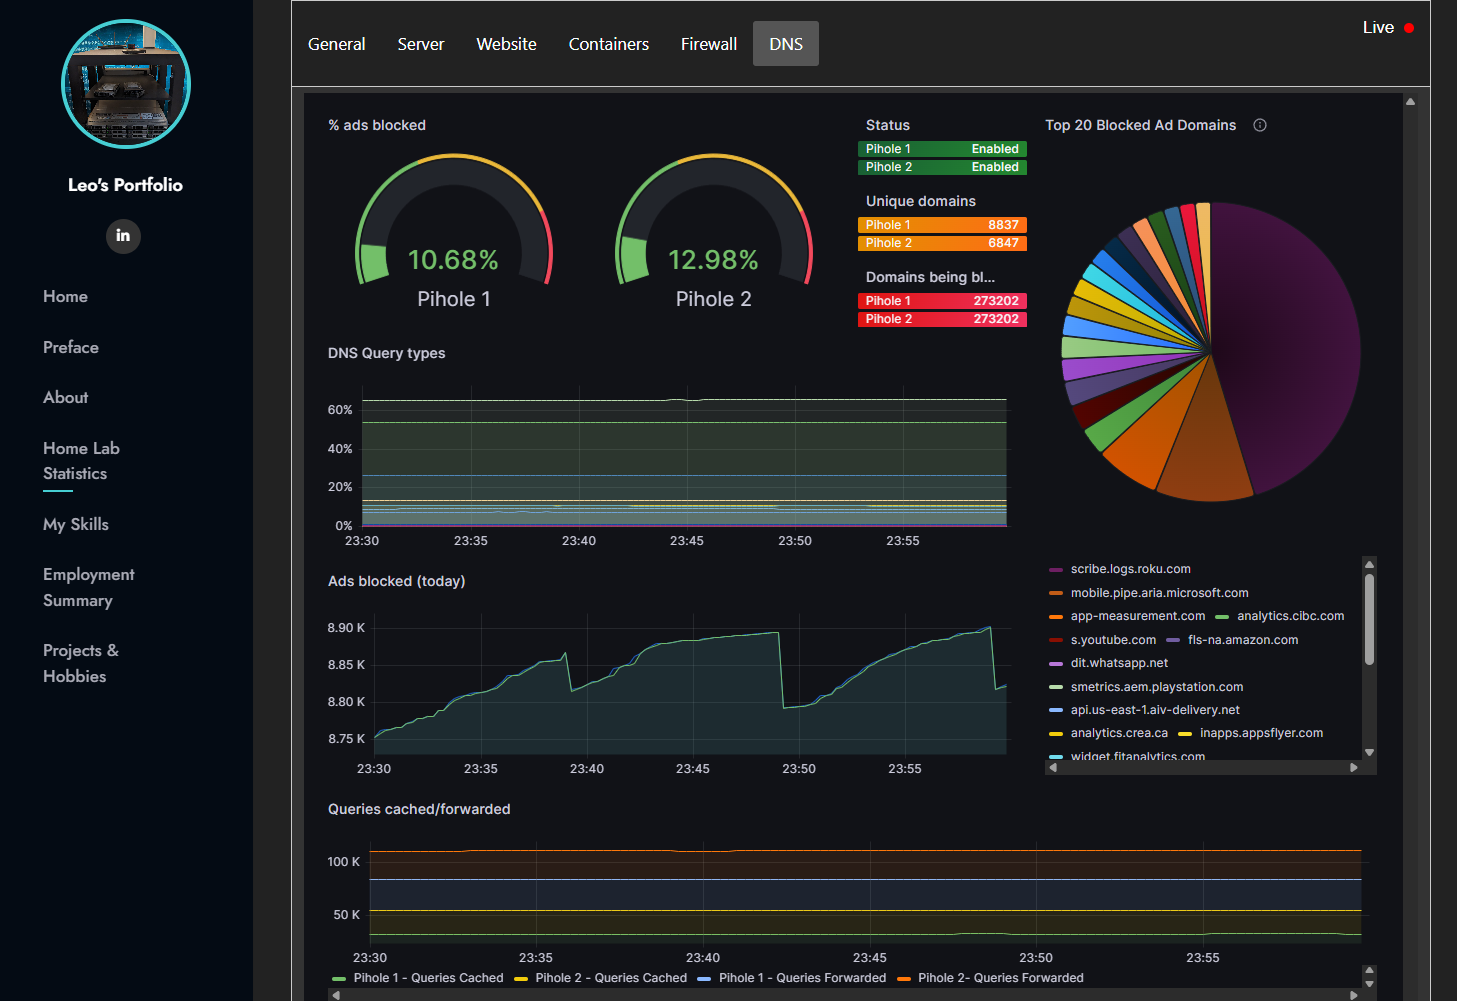
V2 and V3 exposed selected Grafana dashboards through the old portfolio. I wanted the same idea in V5, but rebuilt the monitoring stack around VictoriaMetrics, Loki, Grafana Alloy and Grafana instead of restoring the old Prometheus / InfluxDB setup.
Alloy collects host and container metrics from Unity and Tartarus, along with service-specific telemetry from UniFi, Pi-hole and the storage hardware. pfSense sends structured firewall logs into Loki, where the filter events are parsed and enriched with geographic and ASN data.
The public site does not connect directly to Grafana or expose the monitoring backend. A small metrics service queries an approved set of VictoriaMetrics data and writes a sanitized JSON payload used by the live architecture and homepage visualizations.
Building the new service stack
I am not rebuilding V4 service-for-service. The current environment keeps the services I still use and adds new internal infrastructure where it is useful.
Host, container, network, DNS, firewall and application telemetry collected into a central metrics and logging stack.
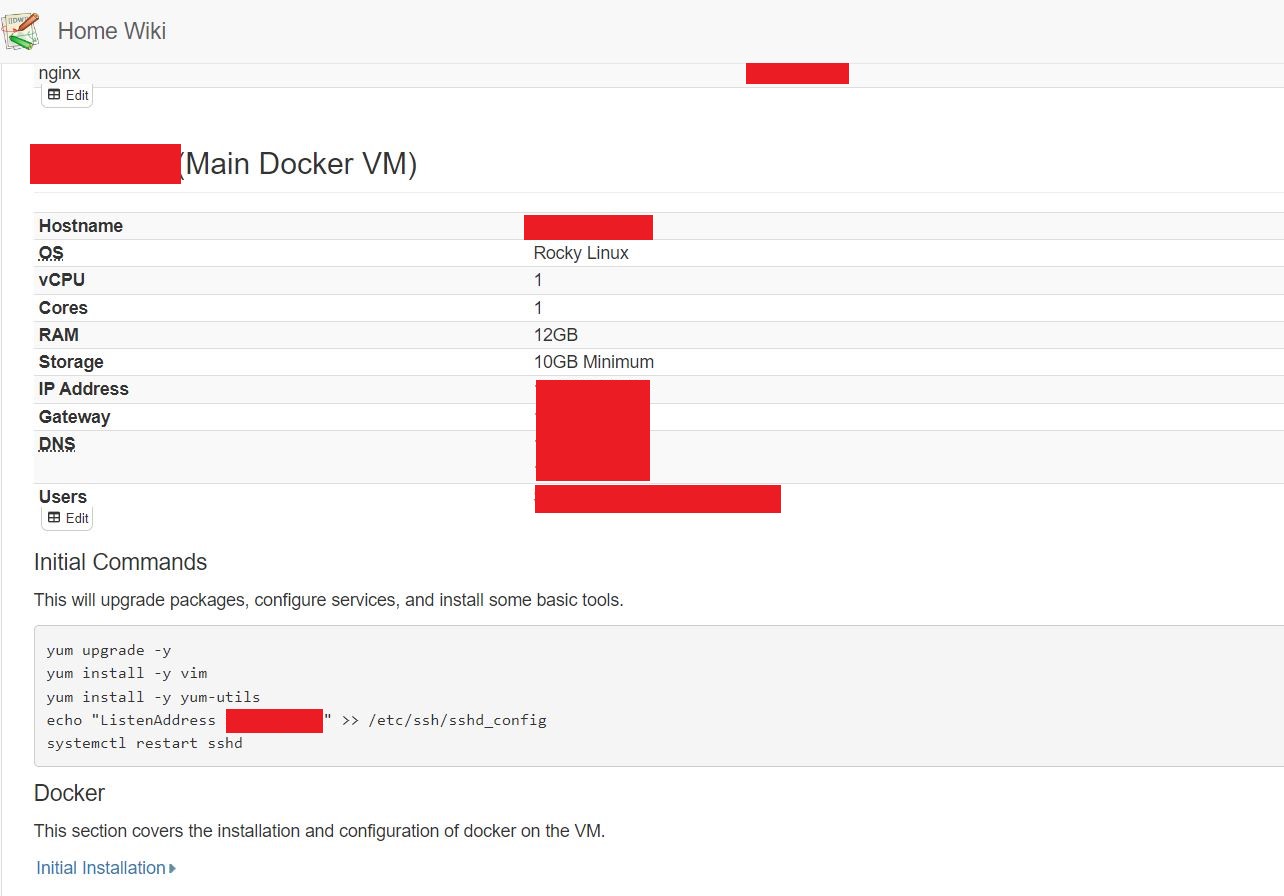
Self-hosted documentation workspace backed by PostgreSQL and Redis for service notes, build documentation and internal reference material.
Internal certificate authority and supporting portal used for certificates across trusted services.
Internet-facing services terminate on Tartarus in the DMZ instead of being published directly from the primary Docker host.
V5 is running. The rebuild is not quite finished.
The compute, network, DMZ, monitoring, public hosting and documentation environments are in place. A few service migrations and hardware changes are still outstanding, so the full V5 write-up and final photography will come after the rebuild is complete.